Evaluating the Robustness of Linear Discriminant Analysis
Introduction
In this blog post, I will evaluate the performance of Linear Discriminant Analysis (LDA) in a classification task, when LDA’s underlying assumptions are violated. Through a series of simulations, the effects of different types of misspecifications, and different severities of those misspecifications, on LDA’s performance are explored [1].
Linear Discriminant Analysis
As a reminder, LDA is a statistical method that can be used as a supervised classification model. LDA makes the following assumptions [2] (however, it is believed that LDA is ”robust to slight violations of these” [2]):
- The independent variables have (Multivariate) Normal distribution within each class
- The Variance/covariance of the predictors is equal across all classes, whereas the mean (vector) is class-specific
- Observations in the sample are independent
- Predictive power can decrease in the presence of multicollinearity
The Classification Task
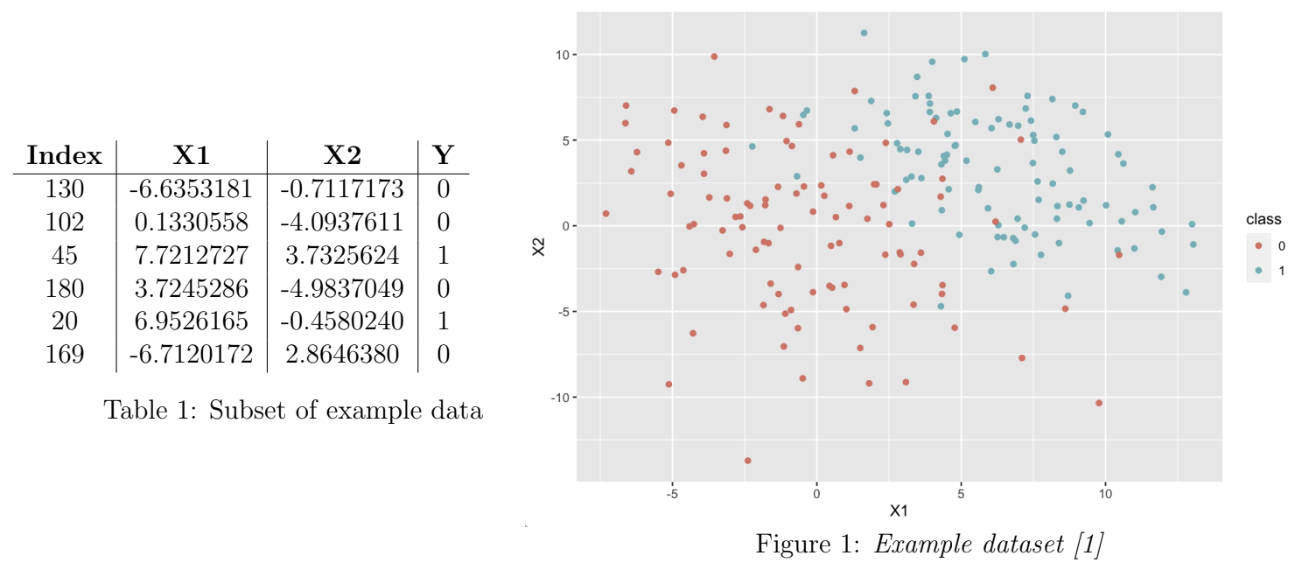
The task is that of binary classification of observations in a dataset. The dataset (n = 200) is composed of two covariates, X1 and X2, simulated from a multivariate Normal distribution, and a binary response variable Y representing two classes (0 and 1). The mean vector of the covariates is class-specific (i.e. dependent on the value of the Y), but the variance-covariance matrix is the same across classes. The initial dataset is equally balanced between the two classes (100 observations of each). To illustrate, a subset of an example dataset is given in Table 1. A complete example dataset is visualised in Figure 1.

Experiments
Methodology
Classification performance here is measured in terms of misclassification rate:
\[\frac{\text{Number of Misclassified Observations}}{\text{Total Number of Observations}}\]The three misspecification types (MSTs) that are explored are as follows (misspecifications are in the form of input datasets that violate LDA assumptions):
- MST1: “The covariate data come from a distribution with a heavier tail than the normal, e.g. a t-distribution” [1].
- MST2: “The sampling of classes is imbalanced. This means that the proportions of observations in the two classes in the training sample are not representative of the proportions in the population” [1].
- MST3: “The data are ‘poisoned’. This means that the class labels of a small proportion of the of the training observations are switched” [1].
To conduct this exploration, simulations were performed for each of the 3 misspecification types
as follows (for brevity, the R code used is not included here).
As a first step, 1000 datasets were generated, in 10 batches of 100, where each successive batch had an increasing severity of the misspecification being explored.
Then, for each batch of 100 datasets, the following steps are performed:
- For each of the 100 datasets of 200 observations in the batch:
- Split the dataset such that 70% of observations are used for training and 30% are used for testing.
- Fit an LDA model, using
MASS[3], on the training subset and classify the test subset - Calculate the misclassification rate over the test subset
- Calculate the mean misclassification rate (MMR) over the batch
- Plot, using
ggplot2[4], the MMR against a measure of misspecification severity for that batch
As a baseline for comparison: for the initial dataset without deliberate misspecification, the MMR over 1000 simulated datasets was 12.49%.
MST1
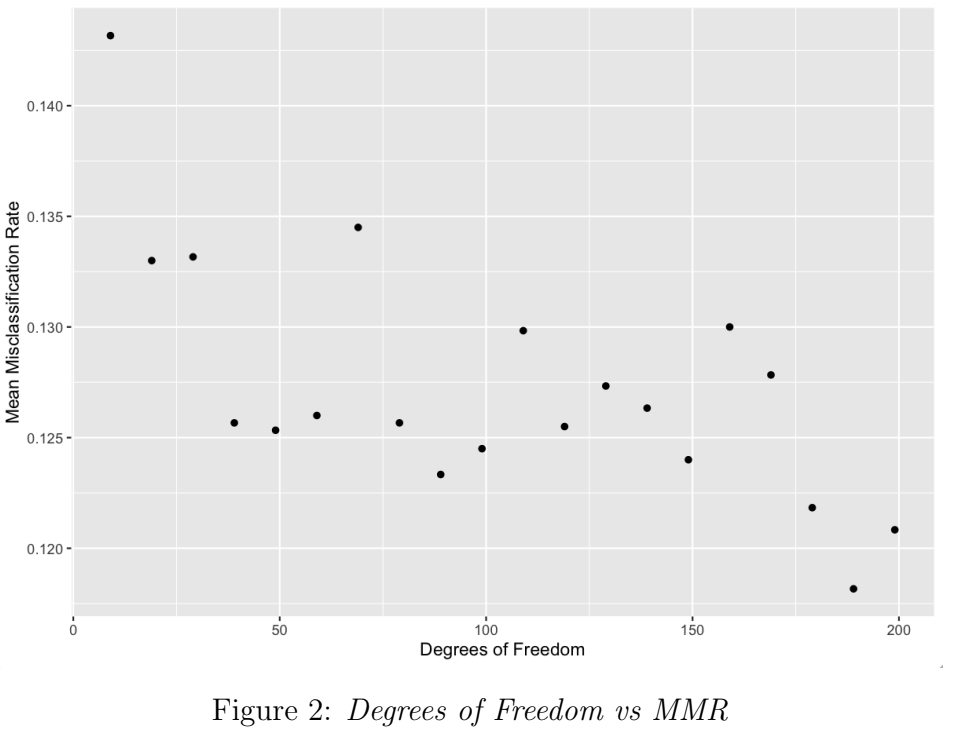
In this simulation, the stats package in R [5] was used to generate datasets that followed the t-distribution, which has heavier tails than the Normal distribution (i.e. positive excess kurtosis). The degrees of freedom control the kurtosis of the t-distribution: by decreasing the degrees of freedom for each dataset batch, the positive excess kurtosis is increased, and thus the misspecification severity is increased. Figure 2 shows a weak negative correlation between degrees of freedom and MMR. As the misspecification severity increases, MMR increases from 12.1% to 14.3%.

MST2
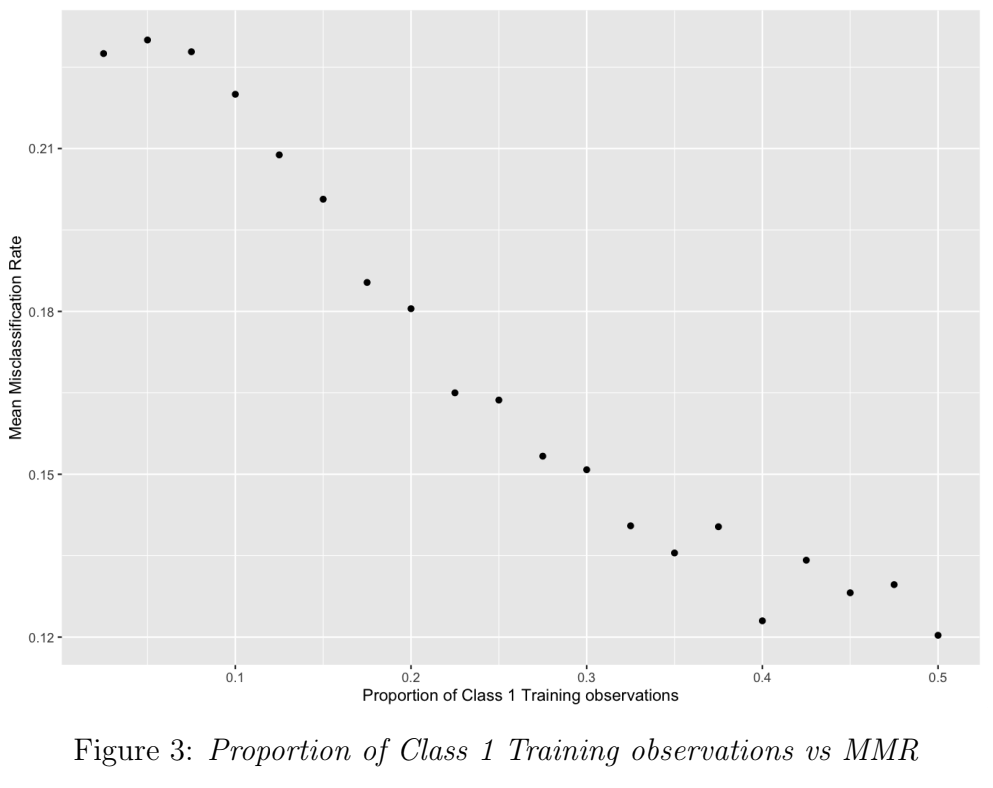
In this simulation, to increase the severity of the misspecification, the proportion of Class 1 observations in the training sample was reduced in each batch, from 0.5 (i.e. the classes were balanced in representation in training) down to 0.025 (classes are imbalanced: fewer observations of Class 1). Figure 3 shows a strong negative correlation between class balance and MMR. As the misspecification severity (class imbalance) increases, MMR increases from 12% to 23%.

MST3
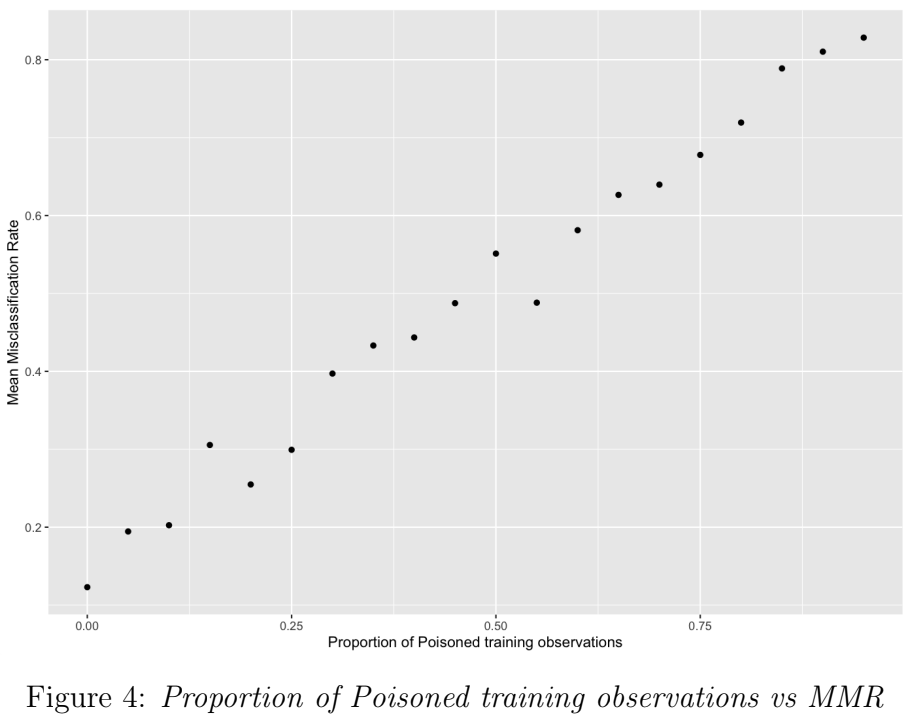
In this simulation, to increase the severity of the misspecification, the proportion of observations with incorrect (switched) labels in the training sample was increased in each batch, from 0 (i.e. no poison: all observations are correctly labelled) up to 0.95. Figure 3 shows a strong positive correlation between poisoned-proportion and MMR. As the misspecification severity (poisoned-proportion) increases, MMR increases from 12.3% to 82.8%.

Conclusion
We have seen how LDA performance changes under different types of, and severities of, misspecifications. While LDA is relatively robust under violations of its Normal distribution assumption (MST1), its performance drops more rapidly under more egregious violations such as MST2 and MST3, where it is given misrepresentative and incorrect training data respectively.
References
- Hallsworth, C. MLDS Supervised Learning. Imperial College London. 2022.
- Wikipedia: Linear Discriminant Analysis.
- Venables WN, Ripley BD (2002). Modern Applied Statistics with S, Fourth edition. Springer, New York. ISBN 0-387-95457-0,
- Wickham, H. ggplot2: Elegant Graphics for Data Analysis. Springer-Verlag New York, 2016.
- R Core Team (2022). R: A language and environment for statistical computing. R Foundation for Statistical Computing, Vienna, Austria.
Note: This post is based on a report written for an assignment as part of my degree in Machine Learning & Data Science at Imperial College London. The assignment was part of Supervised Learning module taught by Dr. C Hallsworth (all credit due for the assignment setting and the goals and objectives of the analysis).

 Bluesky