Exploring Language in Classic Fiction with Data and R
Introduction
In this post, I will present an exploratory data analysis and visualisation of natural language data from a collection of 26 fiction books by six English-language authors. The data was downloaded from the Project Gutenberg website [1]. For the purposes of this analysis, we treat each book as a document, and the collection of 26 books as a corpus. The text content of each book was pre-processed to remove irrelevant text added by Project Gutenberg.
The analysis is performed using R. As part of the analysis, I applied dimensionality reduction techniques such as Principal Component Analysis (PCA), Multidimensional Scaling (MDS), and t-SNE. I also used clustering methods such as K-means and Hierarchical clustering.
Initial Exploratory Data Analysis
For an initial exploratory analysis of the data, a subset of the corpus containing 2 documents was selected (hence, the ’Corpus Subset’). The Corpus Subset comprises: Great Expectations, by Charles Dickens, and The Sign of the Four, by Sir Arthur Conan Doyle. Statistics of the Corpus Subset texts are presented in Table 1.

The statistics in Table 1 give some insight into the writing style of the documents. For example, we see that Dickens’ sentences were longer than Doyle’s, containing 19.2% more words on average. Dickens’ book is also longer, containing 4 times as many words as Doyle’s. This difference in word count and sentence length possibly reflects the nature and era of the texts and their intended audiences: Dickens’ text is a relatively older novel that depicts and critiques the social and cultural landscape of 19th Century England (requiring more words and more complex sentences) whereas Doyle’s work is of the entertainment genre (detective mystery).
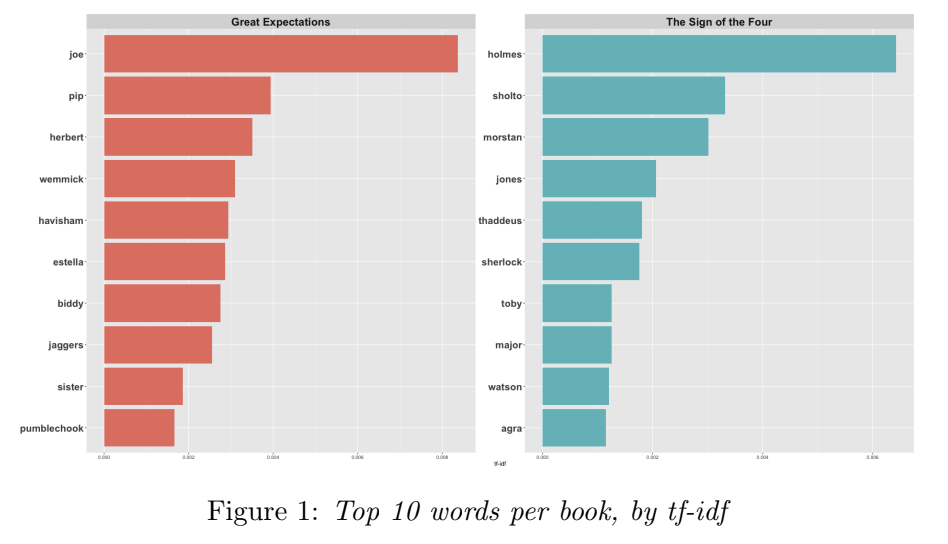
Figure 1 presents the top ten words in each Corpus Subset document based on tf-idf (the definition of tf-idf used is the one implemented by bind tf idf in tidytext [2]). Pre-processing was performed to remove the ‘stop’ words (based on a list of stop words in the tidytext package [2]). From Figure 1, we can quickly see the key characters and themes of each book. For example, ‘Holmes’ is the name of the main character in ‘The Sign of Four’, and ‘Joe’ is the name of one of the main characters in ‘Great Expectations’.
Similarly, Figure 2 shows the most common words in each of the subset documents, in the form of word clouds, and gives insight into the key characters in the documents.

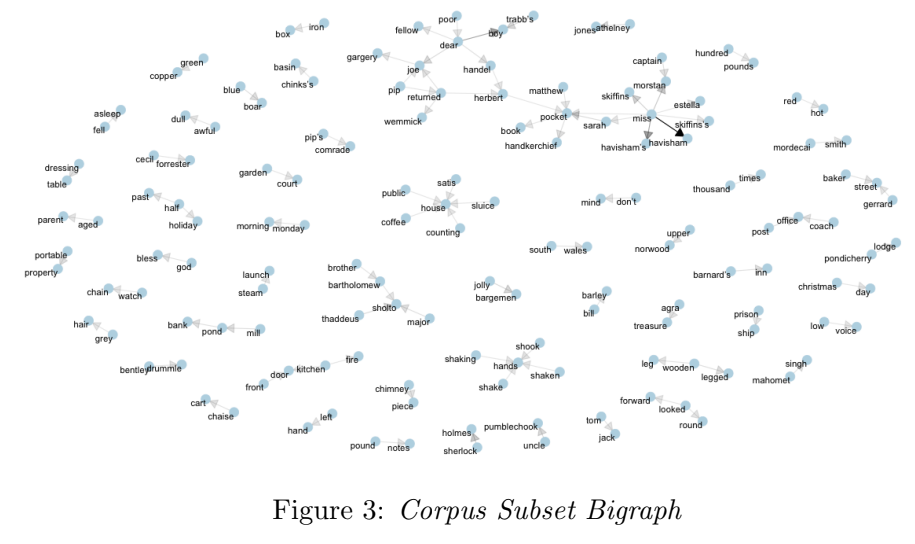
Figure 3 provides another view into the language used in this Corpus Subset: the bigraph shows common bigrams (based on frequency) and their interconnections. There is a large cluster at the top, centered on the words ‘miss’ and ‘dear’; possibly reflecting the formal language used in the books, both of which were published in the 19th century.
Similarity of Language
We now turn our attention to the full data set containing the corpus of all 26 books, which is analysed to assess the similarity of language used across the corpus. The data was first pre-processed in the following way:
- Each document in the corpus is tokenized into bigrams
- The bigrams are filtered to remove any bigrams that contain at least one stop word, producing p bigrams. In this corpus, p is ~145,000.
- The tf-idf of the remaining bigrams is calculated (using
bind_tf_idffromtidytext[2])- tf-idf is used here rather than raw term frequency count because we want to account for varying document lengths
- A data matrix (DataMatrix) is constructed, converting the data from wide format to long format
- This matrix has dimensions 26 × p. That is, 26 rows (one for each document), and p columns (one for each bigram).
- Each cell in the matrix contains the corresponding tf-idf value. The value in DataMatrixi,j is the tf-idf of bigram j in document i.
Distance as Similarity
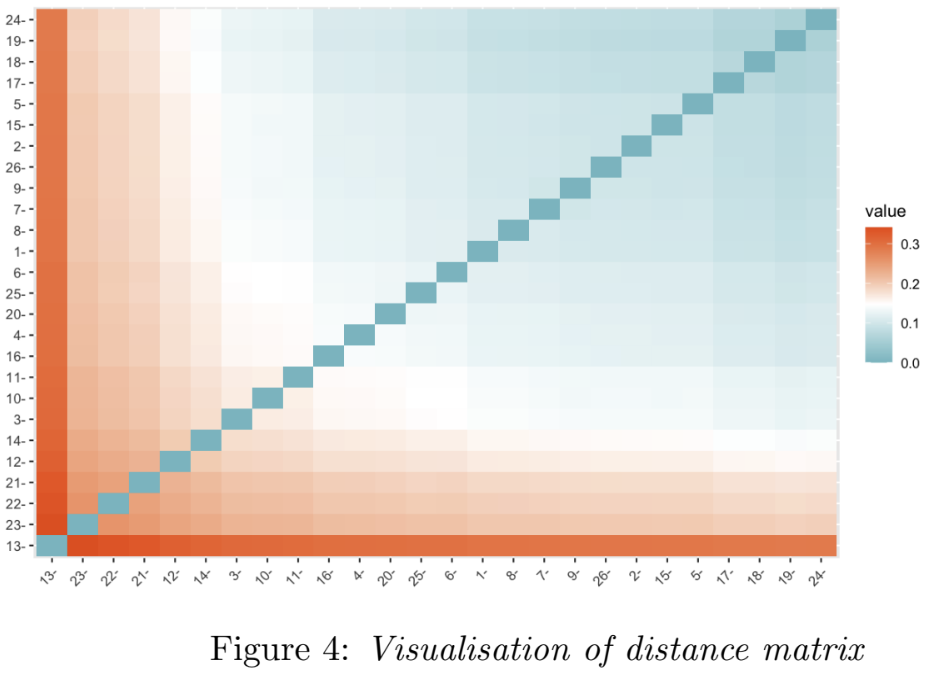
A distance matrix is then calculated from the DataMatrix, and visualised in Figure 4; it shows that document 13 in the corpus (The Eyes Have It, by Dick) is most distance to the rest, followed by document 23 (The Missing Will by Christie). In this analysis, we consider distance in the tf-idf vector space as a signal of similarity of language - i.e. documents whose tf-idf vectors (represented in DataMatrix) that are close in that space use similar language.
Dimensionality Reduction
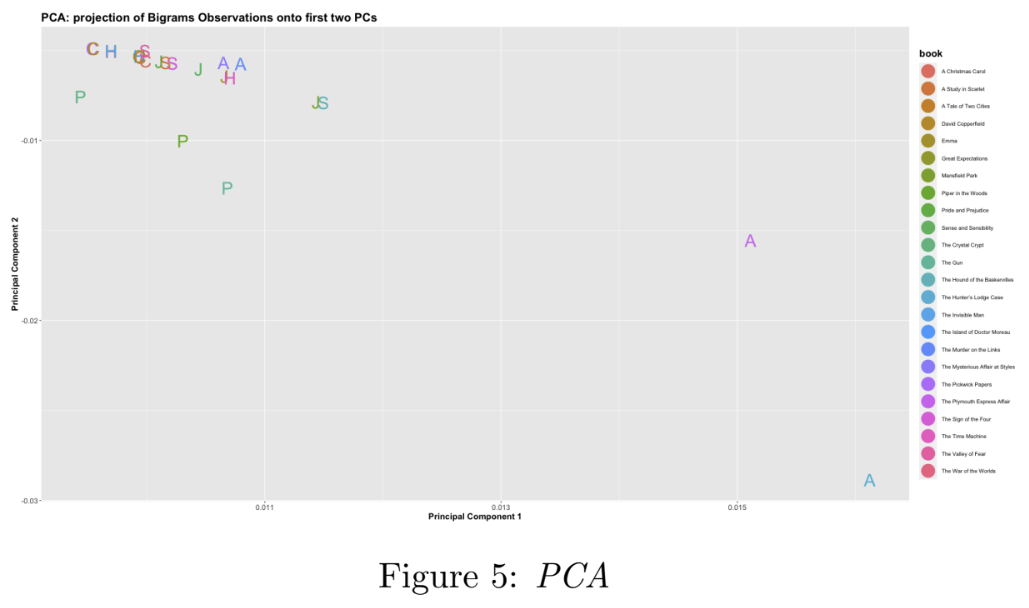
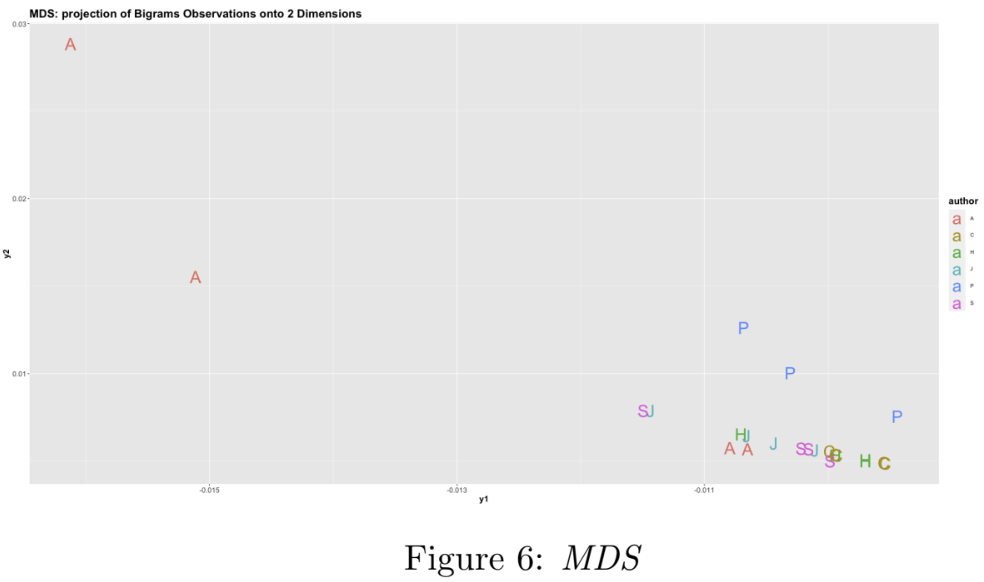
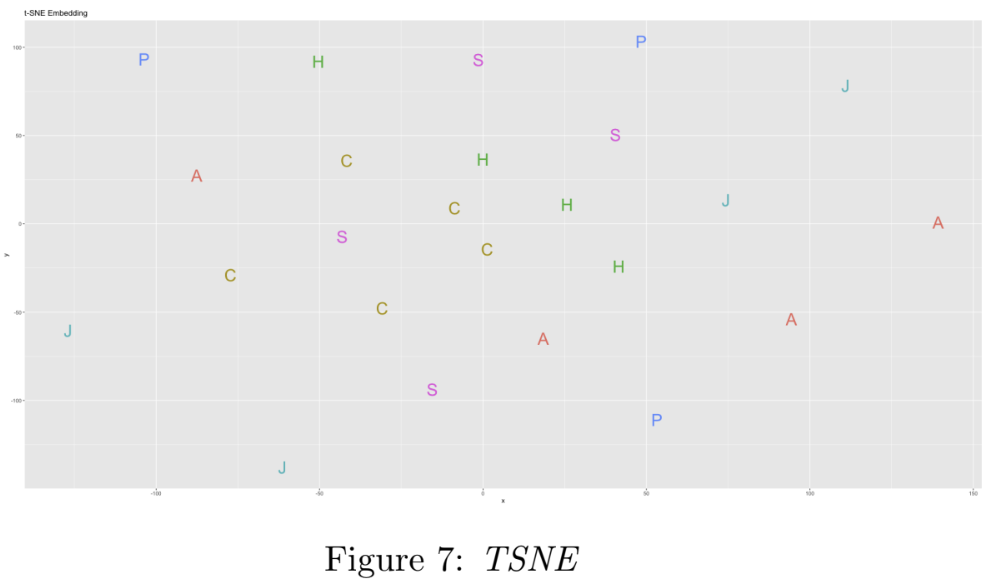
Next, Dimensionality Reduction is performed on the DataM atrix. Reduced dimensions are necessary for reducing the computational cost of the subsequent clustering operations, as well as facilitating visualisation. Dimensionality Reduction (down to two dimensions) is performed using three techniques (1) Principal Component Analysis (PCA), (2) Multidimensional Scaling (MDS), and (3) PCA followed by t-SNE; the results of which are visualised in Figures 5, 6, and 7 respectively. Importantly, these methods preserve ’closeness’ (points that are close in the higher-dimensional space are close in the lower-dimensional space).
Notes on the implementation: In method (1), the first two principal components were found to explain only 18% of the variance in the data. In method (3), PCA is performed first as t-SNE is computationally expensive, and using it directly is impractical on a dataset of this size. Finally, the two outlier points mentioned earlier - documents 13 and 23 - were removed to improve the visualisations by ’zooming in’ on the main cluster points.
Clustering
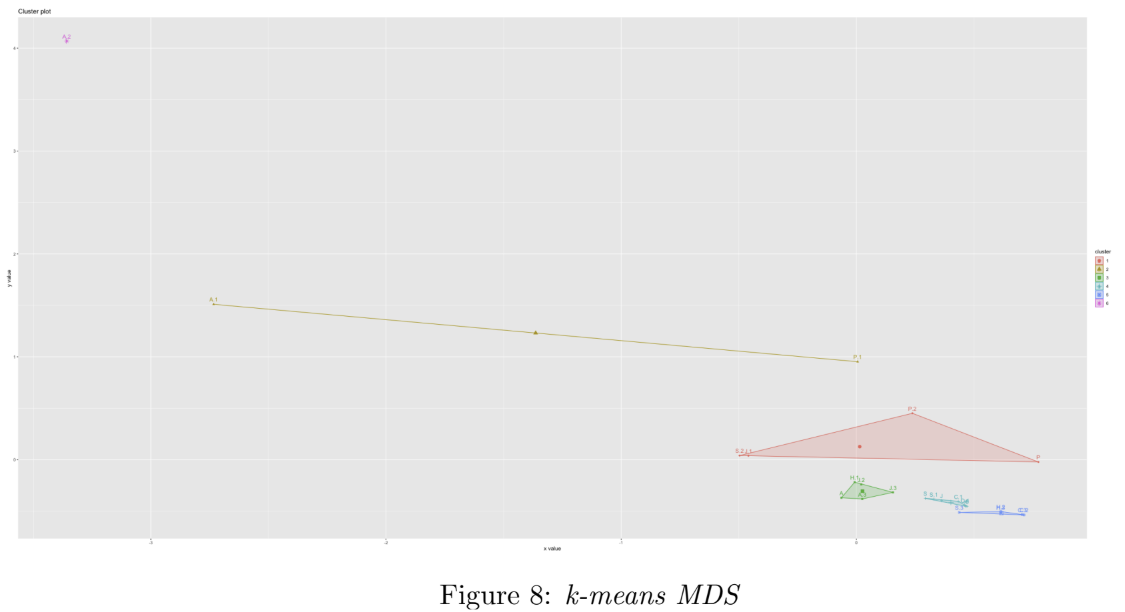
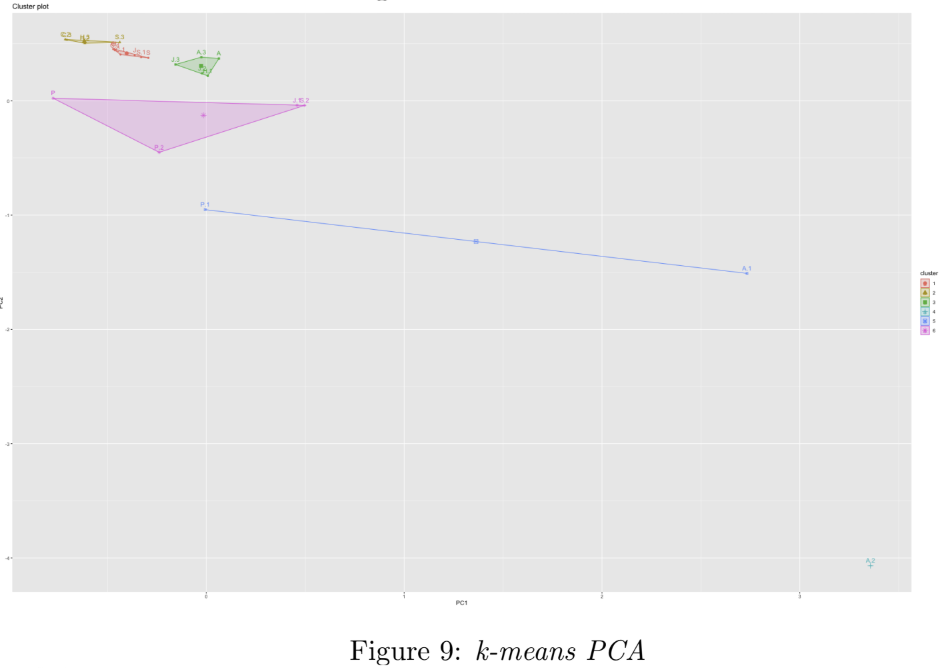
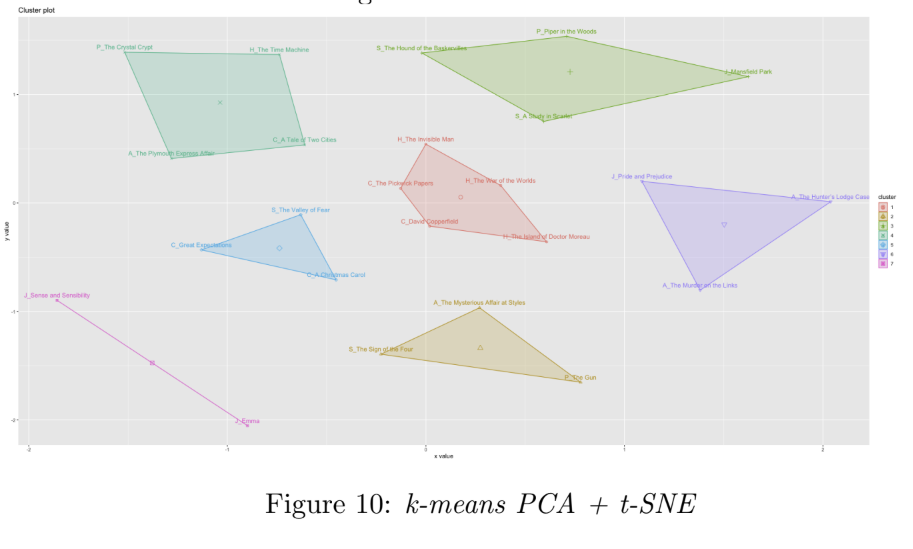
In order to group the documents by similarity of language, k-means clustering was performed on the three reduced-dimension data sets. Figures 8, 9, and 10 show the resultant clusters (book titles are replaced by the authors’ initials in Figures 8 and 9, for better visualisation). In each case, the values for K were selected using a combnination the elbow method (using fviz_nbclust from the factoextra R package) and visual inspection of the resulting clusters. We can see that the third approach in Figure 11 (PCA followed by t-SNE followed by K-Means) results in the clearest separation of clusters; we see some of the works by the same author are grouped to together, e.g. three of Dickens’ works appear together in the middle red cluster, and two of Austen’s works appear together in the pink cluster (bottom left).
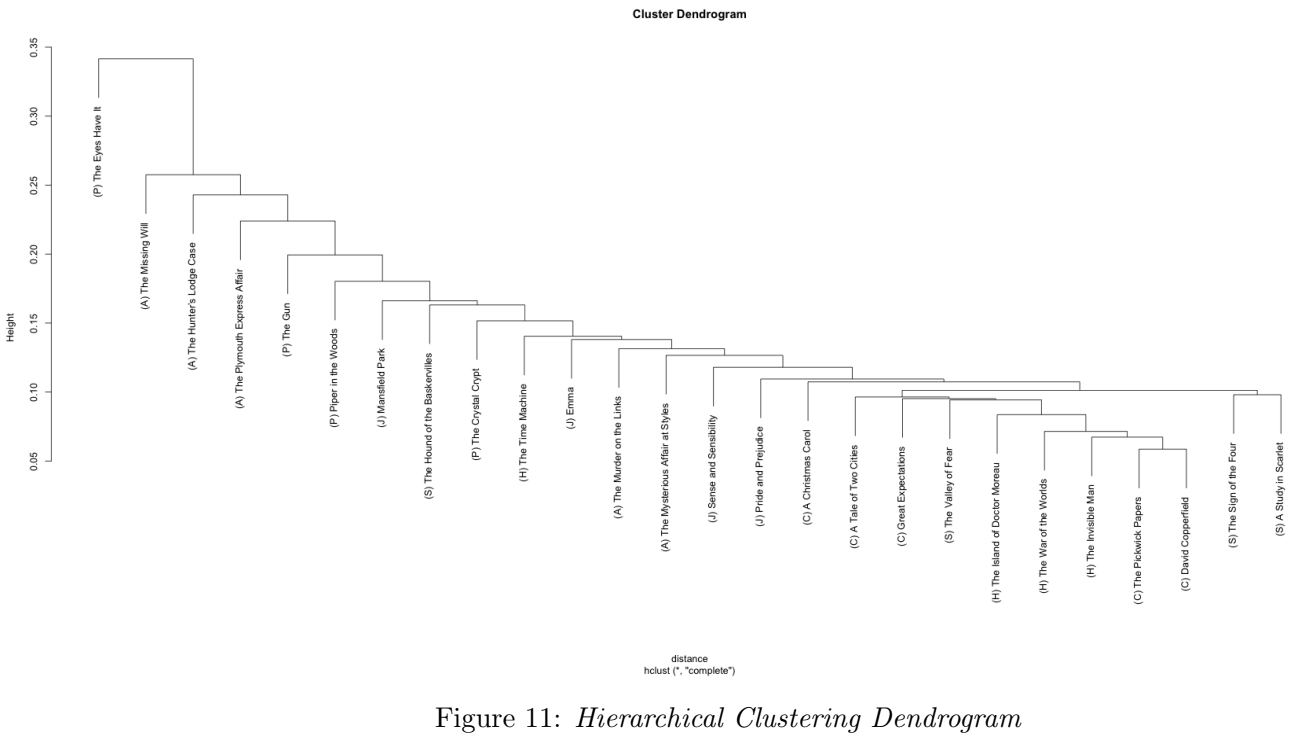
Hierarchical Clustering was also performed on the documents, in the high-dimensional space. Figure 12 shows the resultant dendrogram. Towards the left of the diagram, we see a cluster for The Eyes Have It (document 13, the outlier, from earlier), suggesting this book’s language is quite different from the other books. Towards the right we see clusters for Doyle’s books, The Sign of the Four and A Study in Scarlet.
Conclusion
In conclusion, this report has demonstrated that a number of techniques can be applied to analyse and visualise unstructured textual data and identify patterns. While some patterns do emerge when clustering (i.e. subsets of the same author’s works appearing together), in all methods there are limitations, as shown by the lack of intuitively-understood clusters.
Prior to performing clustering, this report’s author had some expectations of the number of clusters that would possibly emerge in this corpus: perhaps six clusters reflecting the six authors, or three clusters reflecting the three genres that might broadly categorise the corpus (Detective Mystery - Christie and Doyle, Sci-Fi - Wells and Dick, Victorian Life - Dickens and Austen), or clusters around publication dates (intuitively: language changes over time). Further analysis and exploration should pursue uncovering these deeper patterns.
References
- Project Gutenberg. (n.d.). Retrieved April 2023, from www.gutenberg.org.
- Silge, J., & Robinson, D. (2016). Tidytext: Text mining and analysis using tidy data principles. R. Journal of Open Source Software, 1(3), 37.
Note: This post is based on a report written for an assignment as part of my degree in Machine Learning & Data Science at Imperial College London. The assignment was part of Exploratory Data Analysis & Visualisation module taught by the inspiring, knowledgable and supportive Dr. J Martin (all credit due for the assignment setting, the goals and objectives of the analysis, and the selection and provision of the dataset).

 Bluesky